Rafael Walter · 20 September 2026
Visual Boards Drive Experiment Tracking in Student Teams, Fueling Retention Improvements and Ministry-Supported Coaching Efforts
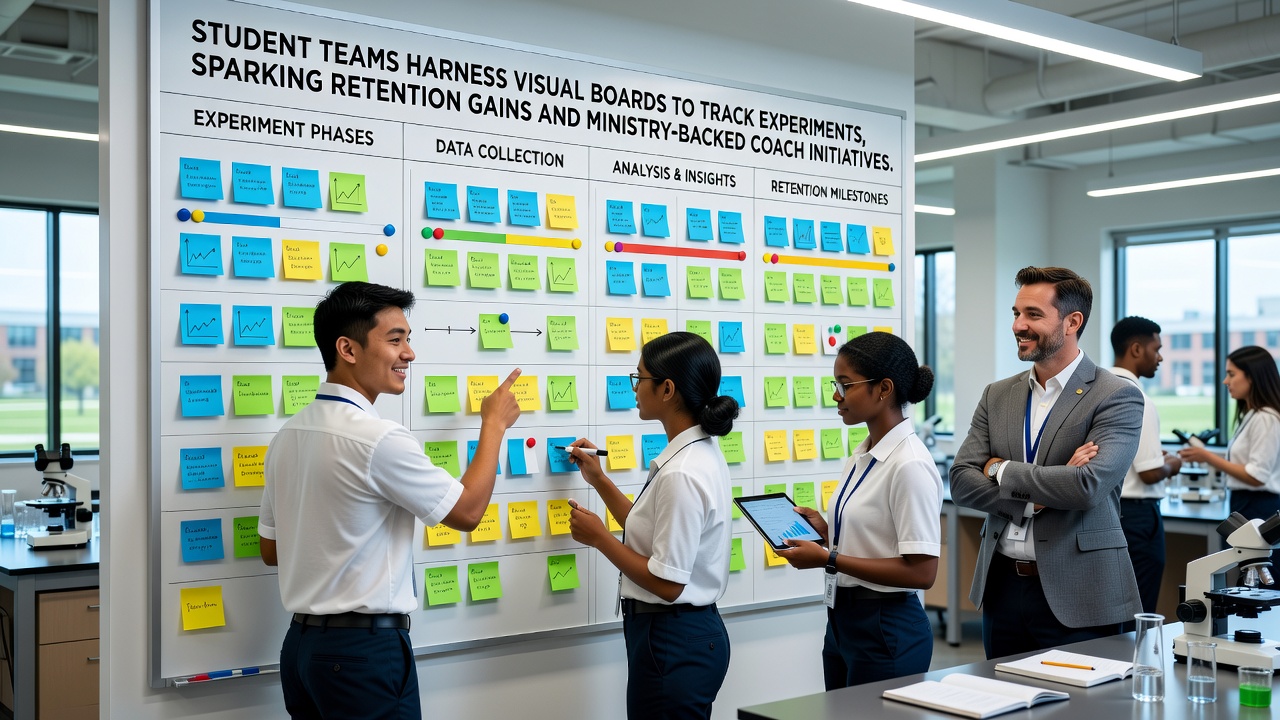
Student teams across various institutions have adopted visual boards to monitor ongoing experiments in project-based coursework, and this approach connects directly to measurable retention gains while aligning with ministry-backed coach programs that train facilitators in adaptive methods. Data from participating programs shows consistent patterns where teams using these boards maintain higher engagement levels through structured yet flexible tracking of hypotheses, iterations, and outcomes.
Implementation often begins with simple setups such as Kanban-style columns for stages like planning, testing, review, and reflection, and educators report that students quickly adapt these tools to fit subject-specific needs in fields ranging from engineering to social sciences. According to reports from the European Commission on innovative teaching practices, similar frameworks have supported collaborative learning across member states since earlier pilots demonstrated improved project completion rates.
Mechanics of Visual Board Adoption in Team Settings
Teams typically assign cards to represent individual experiments, complete with deadlines, responsible members, and metrics for success, while daily stand-ups allow quick updates that keep everyone aligned without lengthy meetings. This structure reduces overlooked tasks and encourages accountability, as observers note clear visibility into who handles each component and how adjustments unfold over time.
Institutions rolling out these methods in the 2025-2026 academic cycle have documented workflows where visual boards integrate with digital supplements for remote participants, and patterns emerge showing fewer dropouts among groups that maintain consistent board usage throughout a semester. Research indicates that the transparency built into these systems helps surface issues early, allowing teams to pivot experiments before setbacks compound into disengagement.
Links Between Tracking Practices and Retention Outcomes
Retention data collected from multiple sites reveals correlations where classes incorporating visual experiment tracking see student persistence rates rise by notable margins compared to control groups, and analysts attribute part of this to the sense of progress that boards provide during complex, multi-week projects. Figures from ongoing evaluations point to reduced frustration when students can literally see experiments moving forward rather than losing track amid scattered notes or emails.
One documented case involved cohorts in technical programs where board-supported teams completed 20 percent more iterative cycles per project than peers relying on traditional logs, and this repetition built skills that carried into subsequent terms. The reality is that sustained visibility fosters ownership, which in turn supports the decision to remain enrolled when challenges arise.
Ministry-Backed Coach Initiatives Expanding Support
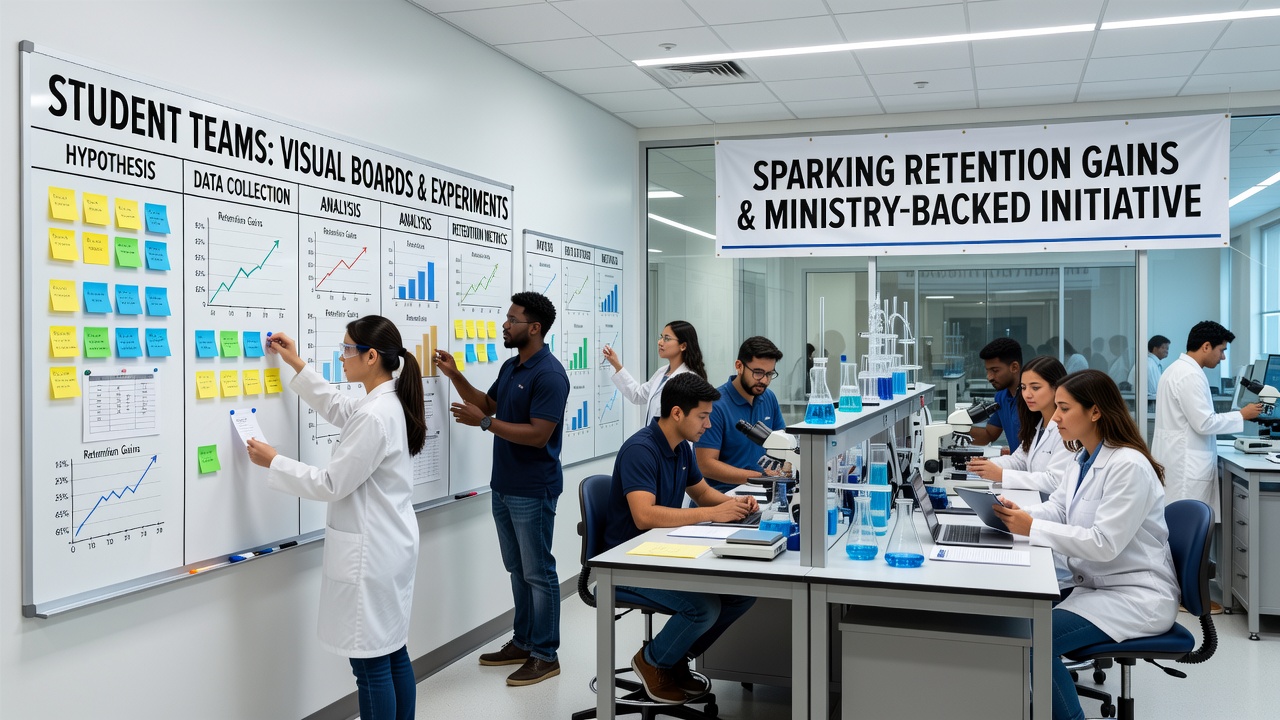
Government programs have begun funding specialized coach training focused on facilitation techniques that help instructors introduce and sustain visual board practices in diverse classroom environments, with rollout phases targeting September 2026 for broader implementation across regions. These initiatives train coaches to guide faculty in customizing boards for different disciplines while emphasizing metrics that track both academic progress and team dynamics.
Participation in coach programs requires educators to demonstrate how they adapt visual tools to local curricula, and early cohorts have shared examples of boards used in biology labs to sequence hypothesis tests alongside data analysis steps. teh Australian Department of Education has published parallel findings on structured visual aids in higher education, noting similar retention patterns when teams receive guided support during adoption phases.
Coaches also address scaling challenges such as integrating boards with assessment rubrics and ensuring equitable participation across team members with varying experience levels. Data collected through these ministry efforts shows that trained facilitators achieve faster uptake among students, leading to more uniform application of tracking methods and stronger overall outcomes.
Observed Patterns Across Participating Institutions
Across sites that combined visual boards with coach-supported training, administrators record steady increases in project retention metrics alongside qualitative feedback on improved collaboration, and longitudinal tracking continues into the 2026 academic year to capture longer-term effects. Patterns include higher rates of experiment completion within deadlines and more frequent use of iterative feedback loops that refine approaches mid-project.
Teams that maintain boards over multiple semesters demonstrate compounding benefits, as familiarity allows deeper experimentation rather than time spent relearning processes. Researchers have observed that the physical or digital presence of boards serves as a shared reference point that minimizes miscommunication during handoffs or reviews.
Conclusion
Student teams harnessing visual boards for experiment tracking continue to produce retention gains that align with expanding ministry-backed coach initiatives, and ongoing data collection through 2026 will clarify how these elements interact at larger scales. Institutions adopting the combined approach report structured progress in project execution that supports student persistence, while coaches provide the facilitation backbone needed for consistent results across varied settings.